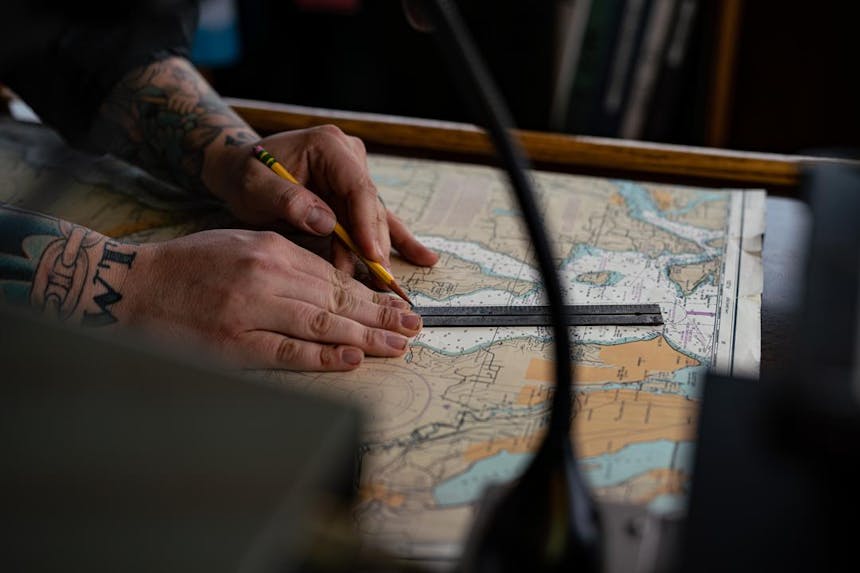
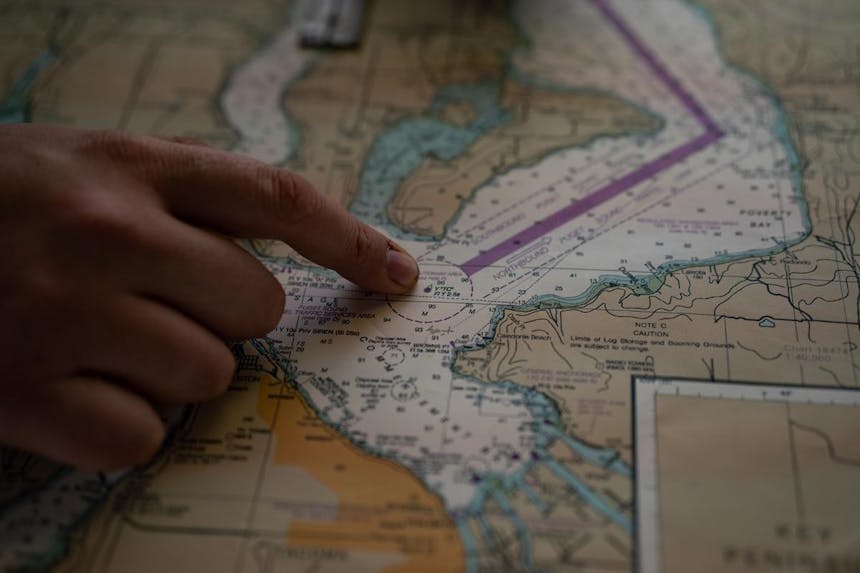
A map will show you where to go. A nautical chart will help you plan your trip, tell you where (and where not) to go, tell you when to go (with the help of tide tables) and where to anchor. This information is continuously changing, which is why it’s prudent to have up-to-date charts.
Nautical charts have many layers of important information, which can be understood fairly easily with a bit of study. First of all, a nautical chart will depict water depth. National Oceanic and Atmospheric Administration (NOAA) charts base this number on the mean lower low water (MLLW) level, which is the average height of the lowest tide recorded at a tide station each day during the recording period. Also depicted in different colors on the chart are sand bars and reefs, which may or may not be visible, depending on tide levels.
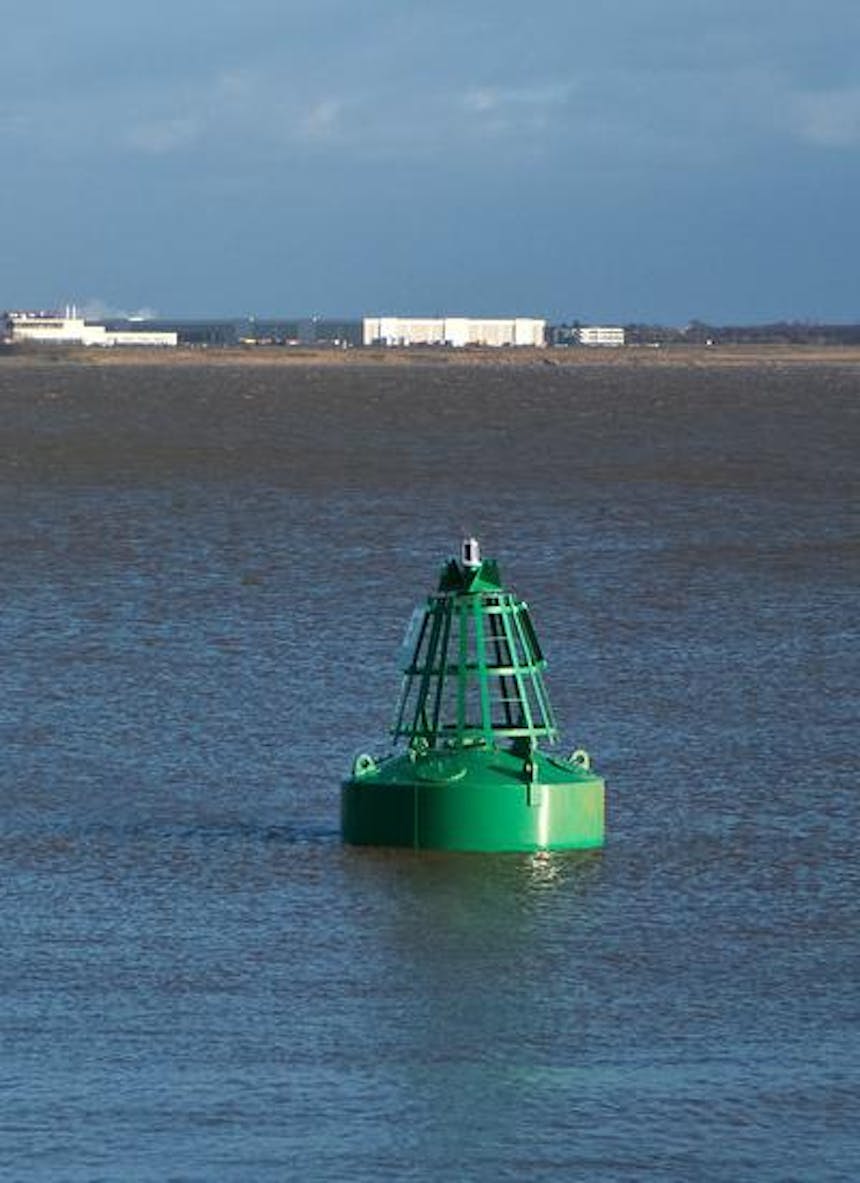
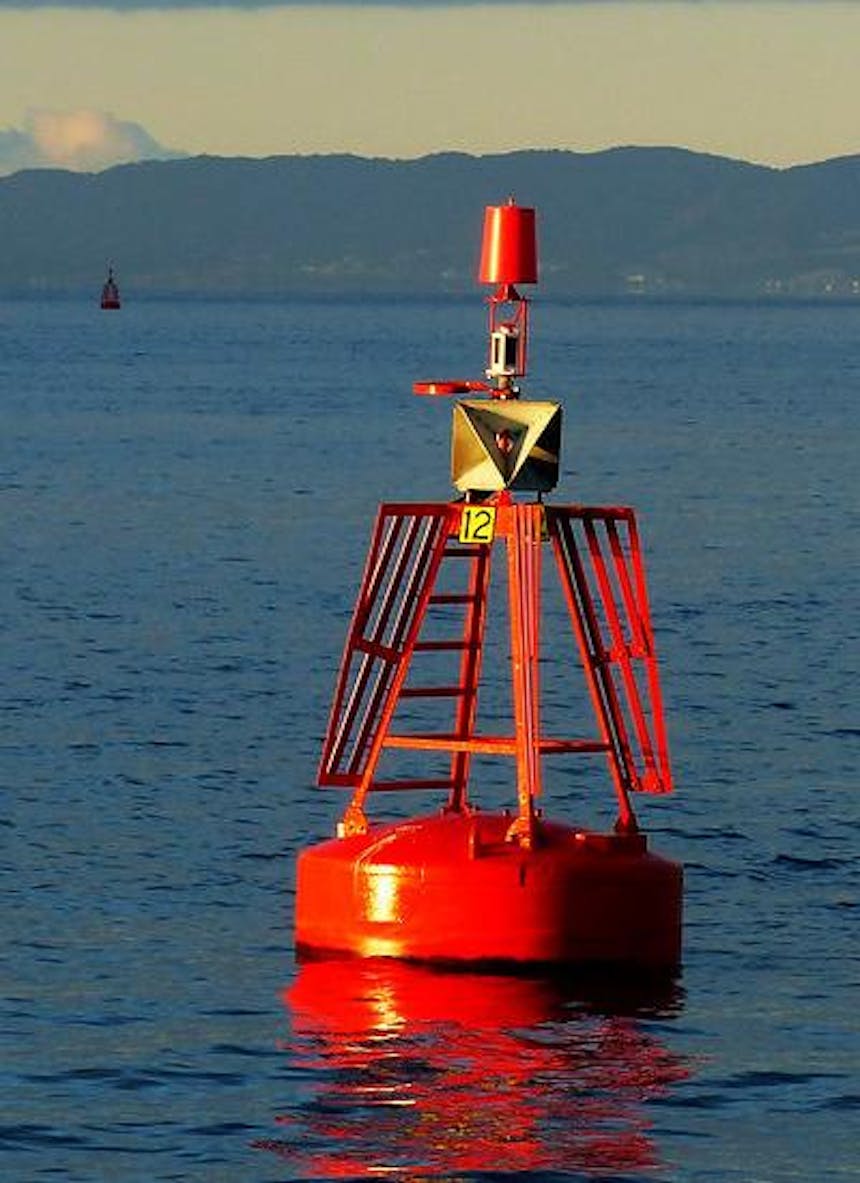
Other key information on the nautical chart concerns buoys, which are aids to navigation placed in waterways to show vessels safe routes, so as to avoid running aground. Red buoys are called nuns because of their conical shape. Green buoys are called cans because they are cylindrical. These buoys are labeled on the charts as either GC (green can) or RN (red nun). The labels have numbers, which generally increase as you head to port and decrease as you head to sea. Red nuns have even numbers while green cans have odd numbers. A handy way to remember the difference is the phrase “7UP cans are green.” Another phrase to remember is “Red Right Returning”. As you head into a harbor, returning from the sea, the red nuns will be on your right (and the green cans will be on your left).
There is information about light markers. Useful details listed on the chart will include how often a light flashes, its height, distance visible, and ID #. For instance, Fl R 6s 30ft 2M “3” means that particular light flashes red every six seconds, is 30 feet in the air, can be seen for two miles, and has the number “3” on it. The chart will also tell you whether or not the buoy or light makes a sound.
A chart will also depict hazard warning symbols. This is valuable information. At high tide, things that are dangerous to you (such as rocks, which are marked with an X) might be hiding underwater, so it’s important to know where they are. Even if a particular rock may not pose an immediate navigation hazard, it could cause a disruption in water flow that could affect your course.
Nautical charts use coordinates to describe where things are located. Latitude divides the Earth from top to bottom into parallel horizontal lines, which start at the equator, at zero degrees (0°) of latitude, going up to the North Pole at 90 degrees North (90°N) and down to the South Pole at 90°S. Longitude lines run vertically, from Pole to Pole. The 0° line runs through Greenwich, England, and the lines are labeled “east” and “west” from there, meeting at the other side of the globe, at 180°. Each degree (of both latitude and longitude) is broken into 60 minutes. Each minute is broken into 60 seconds, allowing for the pinpointing of exact locations.
There is always an equal distance between lines of latitude, and therefore they are able to be used for measurement. One minute of latitude equals one nautical mile, or 1.1508 land miles. But longitude cannot be used to measure distance, as the lines of longitude converge as they approach the Poles.
All charts have a compass rose, which shows the directions of true north and magnetic north for that particular chart. The outer circle of the compass rose shows true north and the inner circle shows magnetic north, and the variation between the two is shown in the center of the rose.
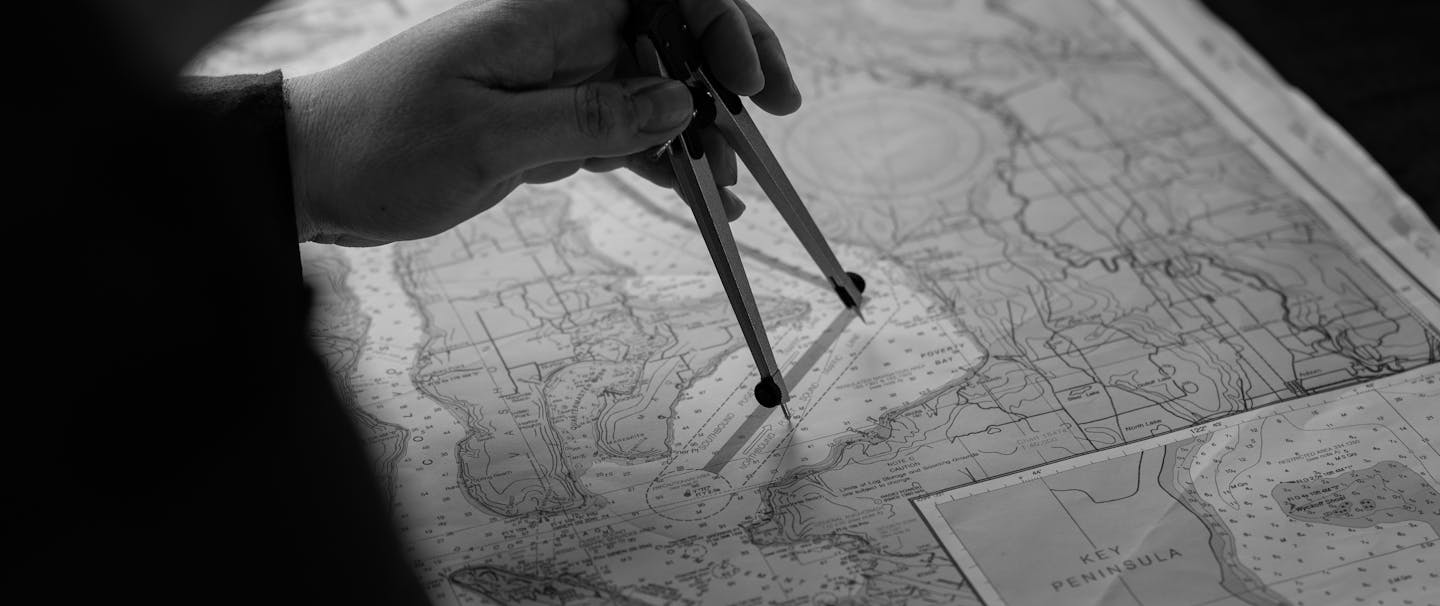
Charts come in a variety of scales. The larger the scale of the chart, the more detailed the information. So if you want an overall look at a long passage, you’ll want a small-scale chart, while if you’re looking to navigate through small passages or into a harbor, you’ll want the largest scale chart you can find. Every chart will have a graphic scale that you can use with a divider tool to measure distances between locations anywhere on the chart.
All charts have a compass rose, which shows the directions of true north and magnetic north for that particular chart. The outer circle of the compass rose shows true north and the inner circle shows magnetic north, and the variation between the two is shown in the center of the rose. Knowing this variation enables you to measure your boat’s direction with a compass (handheld or binnacle) and plot your course accurately on your chart.
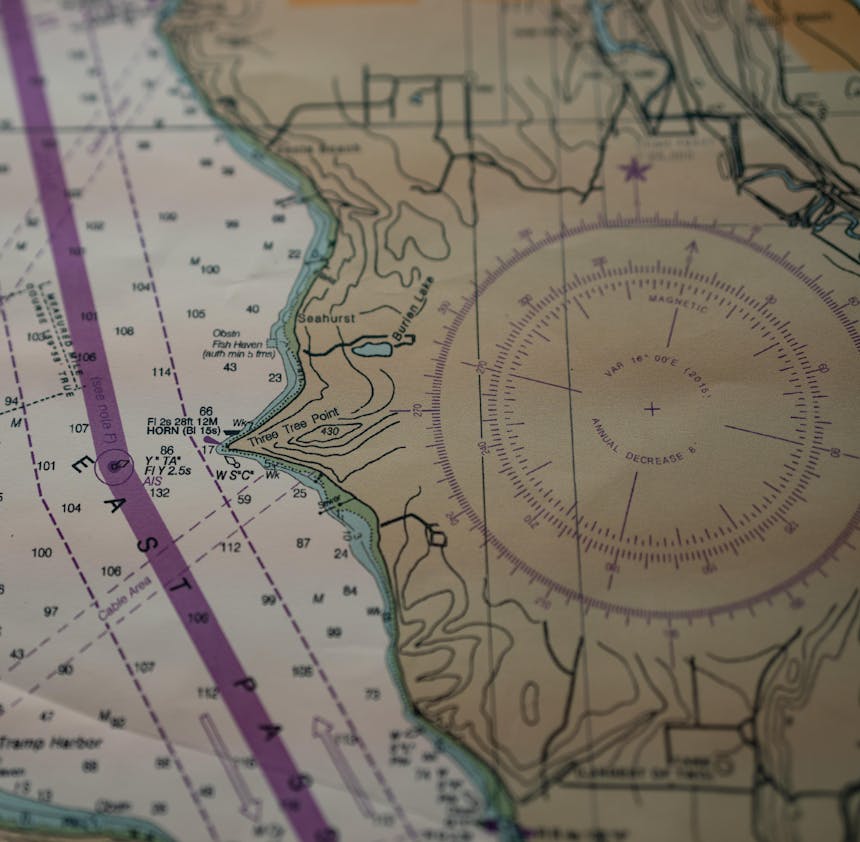
Because true north and magnetic north are at two different locations on the globe, the difference between the two directions varies, depending on your location on the Earth. There are local geological conditions that alter how your compass reads the direction of magnetic north, and the actual location of magnetic north changes from year to year. It is important to always have up-to-date charts that show the current direction of magnetic north so you can accurately plot a safe course to your destination, wherever that may be.